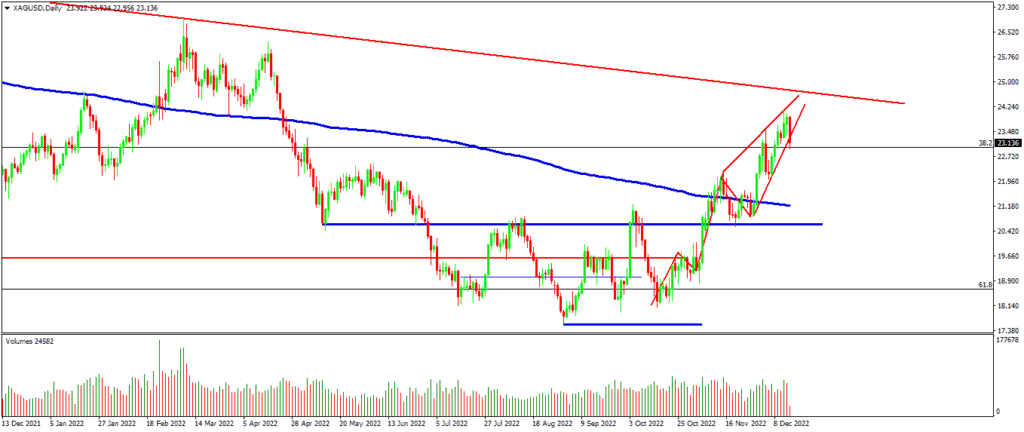

We see how the price of silver has risen for a few sessions, also drawing a very nice technical figure. We see a bullish Elliott module in five waves, where in the last wave, the fifth, he draws, in turn, a Wolfe wave (the terminal wedge that we see above the impulse).
When we see this sequence , a Wolfe in a fifth of Elliott, it is usually a pretty accurate sign that a correction is coming, in fact, it is already doing it, but we think that there may be a little more travel left for the falls.
Once the price reaches around 22 dollars per ounce, we will test the longs again, since the medium-long term scenario continues to be bullish.
Silver Chart (Timeframe – D1)