Good morning, Traders!
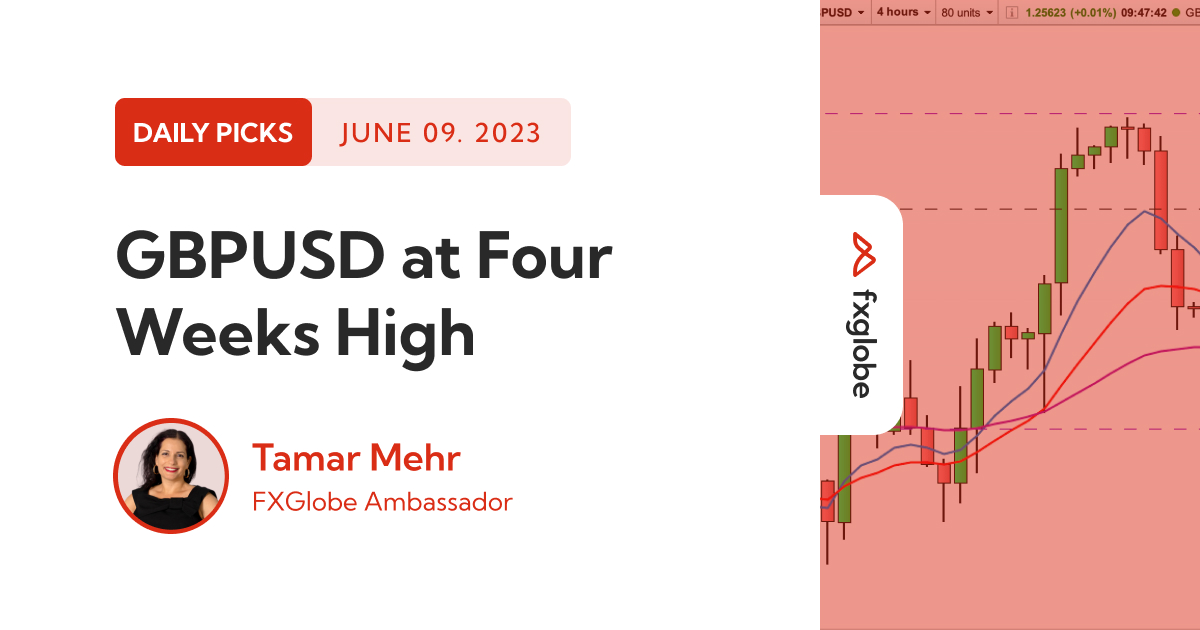
GBPUSD
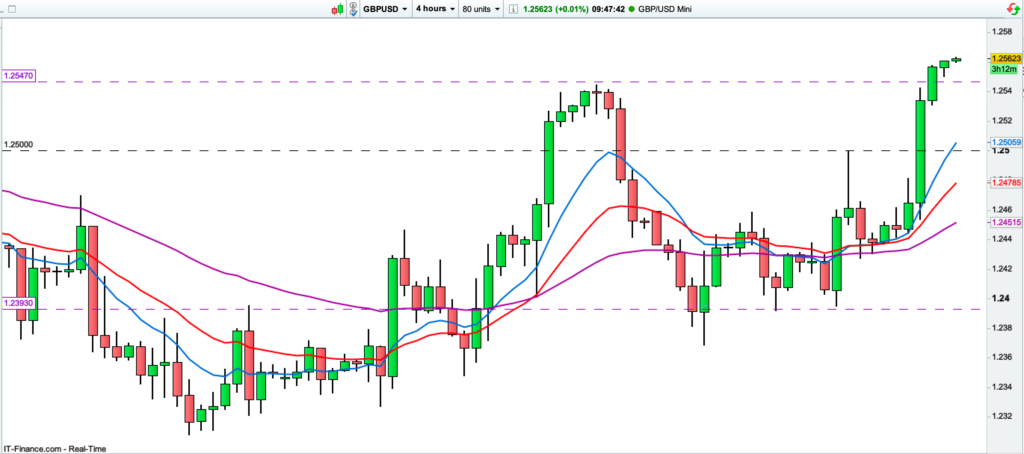
Yesterday GBPUSD broke its resistance level at around 1.2550 to trade and close at a four-week high.
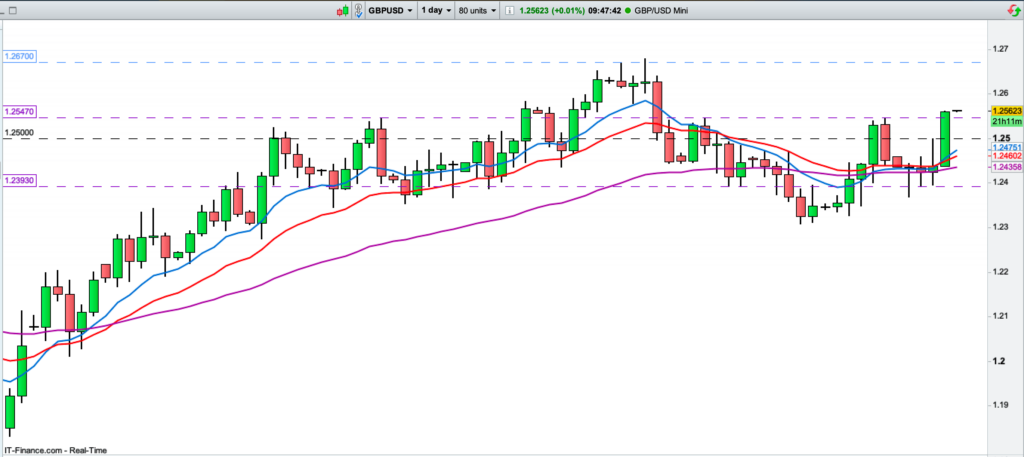
As the move started from low, the market is currently overextended, and I am looking for a potential pullback before a continuation of this bullish momentum.
The area that I am eyeing is the 1.25; it acted as resistance before the market broke decisively above it. And if and when the market will pull back into this area, it may bring it closer to its Moving Averages on the mid-timeframes.
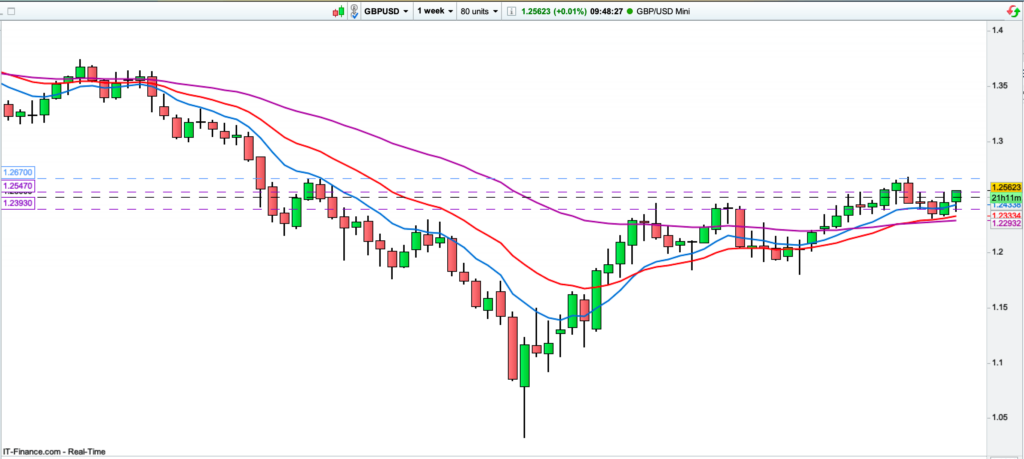
The Weekly timeframe is in an uptrend, and we may see the market moving for another test of the resistance level around the 1.2670 area.
Happy Trading!